:ext QuasiQuotes
import qualified H.Prelude as H
H.initialize H.defaultConfig
[r| require("ggplot2") |]
Bayes Explorations for a Newbie
I'm trying to learn the fundamentals of Bayes. It seems like a very wide subject. My main interest would be applying it to AI but I wanted to start from the basics.
When I was learning probability, to check my answers, I would write a Haskell program to simulate the problem and compare it's anwer to my math answer. It was a great help in building my confidence.
So, I thought I would do the same thing while learning Bayes.
I took what I thought would be an easy problem and wrote a simulator, the results of which are shown below.
My confusion about the results led me to some fundamental concepts that I didn't understand (and probably don't yet), independence, and causality.
Sample Problem
I have a cargo trailer with an alarm system. It sometimes has false alarms. So, I wanted to know if I should panic whenever the alarm goes off.
Or, what is the probability that I am being burgularized given the the alarm is going off?
Ok, so off to a Haskell simulation ..
I generated large boolean vectors to simulate both my alarm going off and burgularies, independent of each other. I know now that this doesn't really represent the situation but suspend disbelief for a moment.
Let the probability of burgularies be 10 percent (pretend I live in a high crime area), and the probability of my alarm going off is 3 percent (bad alarm).
$P_B = 0.10\ \ \ $ Probality of being burgled (from county statistics>
$P_A = 0.03\ \ \ $ From my experience
Here's the relevant code,
import Text.Printf
import System.Random

type Fun  = ((Int,Int) -> (Bool,Bool) -> (Int,Int))
type Cum  = (Int,Int)

data FunCum = FunCum Fun Cum
instance Show FunCum where
   show (FunCum _ cum) = show cum

-----------------
--  Utilities  --
-----------------

genRands :: Double -> Double  -> [Double]
genRands low high =
     randomRs (low, high) (mkStdGen 42)

asBools :: Double -> [Double] -> [Bool]
asBools pctOnes =
   map (\x -> if (x > pctOnes) then False else True)

---------------------
--  Probabilities  --
---------------------

pAGivenB :: [Bool] -> [Bool] -> Double
pAGivenB a b =
          let (bT, aT) = foldl f (0,0) (zip a b)
          in (fromIntegral aT) / (fromIntegral bT) :: Double
    where f :: (Int,Int) -> (Bool,Bool) -> (Int, Int)
          f (cumB, cumA) (a,b) =
                 let bTrues  = if b        then cumB + 1 else cumB
                     aTrues  = if (b && a) then cumA + 1 else cumA
                 in (bTrues, aTrues)

pAandB :: [Bool] -> [Bool] -> Double
pAandB a b =
          let (total, aAndb) = foldl f (0,0) (zip a b)
          in (fromIntegral aAndb) / (fromIntegral total) :: Double
    where f :: (Int,Int) -> (Bool,Bool) -> (Int, Int)
          f (cumT, cumAandB) (a,b) =
                 let aAndbs = if (a && b) then cumAandB + 1 else cumAandB
                 in (cumT+1, aAndbs)

pA :: [Bool] -> Double
pA as =
          let (total, cumA) = foldl f (0,0) as
          in (fromIntegral cumA) / (fromIntegral total) :: Double

    where f :: (Int,Int) -> Bool -> (Int, Int)
          f (cumT, cumA) a =
                 let newCumA = if a then cumA + 1 else cumA
                 in (cumT+1, newCumA)
let cnt = 1000000

  -- Generate the Distributions
  rs <- return $ genRands 0.0 1.0
  burgulary <- return $ take cnt (asBools 0.10 rs)
  alarm     <- return $ take cnt (asBools 0.03 (drop cnt rs))

  -- Do the computation
  let aAndb  = pAandB alarm burgulary
  let a      = pA alarm
  let b      = pA burgulary
  let aGb    = pAGivenB alarm burgulary
  let bGa    = pAGivenB burgulary alarm

  -- A bit of formatting
  let aStr     = (printf "%7.3e" (100.0*a::Double))
  let aAndbStr = (printf "%7.3e" (100.0*aAndb::Double))
  let bStr     = (printf "%7.3e" (100.0*b::Double))
  let agbStr   = (printf "%7.3e" (100.0*aGb::Double))
  let bgaStr  = (printf "%7.3e" (100.0*bGa::Double))

  --putStrLn $ "alarm            =>  " ++ aStr     ++ " percent"
  --putStrLn $ "burg             =>  " ++ bStr     ++ " percent"
  --putStrLn $ "burg and alarm   =>  " ++ aAndbStr ++ " percent"
  --putStrLn $ "alarm given burg =>  " ++ agbStr   ++ " percent"
  --putStrLn $ "burg given alarm =>  " ++ bgaStr   ++ " percent"
After $\ 10^6\ $ samples,
| Percent Probabilities | Value |
|---|---|
| Alarm | 2.965 |
| Burgulary | 9.991 |
| Alarm and Burgulary | 0.2976 |
| Alarm given Burgulary | 2.979 |
| Burgulary given Alarm | 10.04 |
So, first (for fun) let's see if the independence check is passed,
$P(A\ and\ B) = P(A)\cdot P(B)$
Here,
$P(A\ and B) = 0.02976$
$P(A)\cdot P(B) = 0.02965 \cdot 0.0991 = 0.2938$,
..... Pretty close.
Dependence / Causality
The above burgulary and alarm distrubutions are independent but for my specific situation there are some dependencies.
Clearly if there is a burgular my alarm could be activated. And although remote, it's possible that the burgularly could be effected by my alarm if my alarm was going off (accidentally) as the burgular approached my cargo trailer. He would probably just leave (quickly) and his action would not be recorded in the county statistics for burgularies.
There are other reasons my alarm might go off,
- My cat
- The wind (if it was an ultrasonic alarm)
- Part of the ceiling falling in front of the sensor
- A power glitch
- etc....
So, we need to capture all these factors to compute our desired,
$$P\ (\ \ cargo\_crailer\ being\_burgled\ \ \ |\ \ \ alarm\_going\_off\ \ )$$or, from now on, in shorthand,
$$ P(B\ |\ A)$$as I want to know if I should panic when I receive a text message (yes I have an IOT alarm :-($\ \ $) or discount it as another false alarm.
So, let's start with the basics,
$$P(B\ |\ A) = \frac{P(A\ |\ B)\cdot P(B)}{P(A)}$$What do we know?
We will use different numbers than the simulation above.
We can come pretty close with the probability of being burgularized, $P(B)$.
We will ignore the edge case (the burgular hears my alarm and leaves) and just look at the county records for burgularies.
So,
$$P(B) = 0.10$$The $P(A)$ is harder to compute as it's dependent on several factors besides a burgular. Here we will only conder the cat and the wind.
So here we can turn to total probability,
$$P(A) = P(A|B)\cdot P(B) \ +\ P(A|Cat)\cdot P(Cat) \ +\ P(A|Wind)\cdot P(Wind)$$Let's fill in some 'belief' numbers,
$$P(A|B) = 0.95$$$$P(B) = 0.10$$$$P(A|Cat) = 0.03$$$$P(Cat) = 0.50$$$$P(A|Wind) = 0.01$$$$P(Wind) = 0.05$$Yielding,
$$P(A) = 0.95 \cdot 0.10 + 0.03 \cdot 0.50 + 0.01 \cdot 0.05$$$$P(A) = 0.1105$$Now all we have left is, $P(A|B)$
Here we take a guess as to the reliability of our alarm. The manufacturer spec says the it will recognize being burgled 98% of the time.
So,
$$P(A|B) = 0.95$$Putting it all together we get,
$$P(B|A) = \frac{0.95\cdot 0.10}{0.1105}$$or,
$$P(B|A) = 0.85$$Now how do we tackle the edge cases?
In this case the edge cases will likely not change my mind as to calling the police when my SMS message is received (83% instead of 85% ?).
So, let's look at the edge cases. Perhaps a drawing can help.
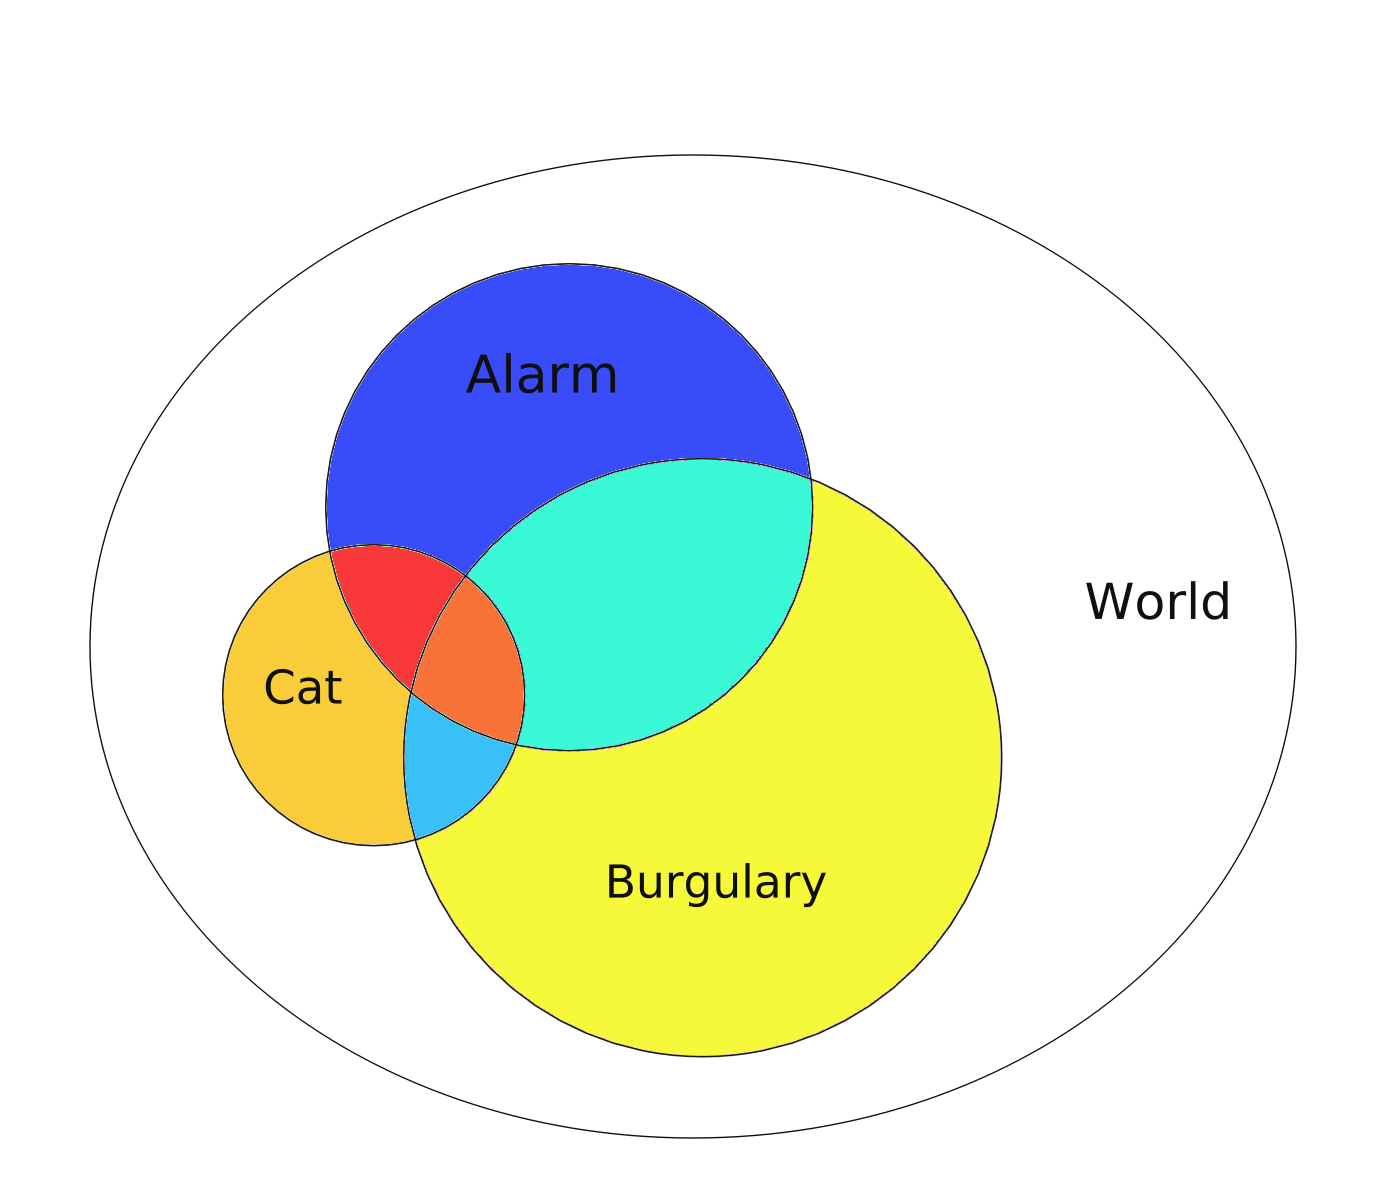
Clearly it's not to scale so we need a bit more of belief suspension :-) So the first question is how does the cat effect our problem. Can we just say $\ \neg {B}\ \ $ for Not Burgulary instead of computing the total probability of Alarm and Cat ? There is clearly a section that the Alarm goes off from the Cat and the Burgular.
Let's figure out what all the colored areas are.
- Dark Blue -> Alarm goes off for no good reason
- Light Teale -> Alarm goes off and there is a Burgularly and the Cat is not involved
- Orange -> The Cat participated in the Alarm going off with the Burgular
- Dark Teale -> The Alarm didn't go off but the Cat and Burgular were there.
- Dark Yellow -> The Cat is just there.
- Red -> The Cat set off the alarm.
Wow .. Now to the math.
What about time frames .. in a year?
External link below,
VPS]
[rgraph|
  ggplot(mtcars, aes(x=wt, y=mpg)) +
  ggtitle("Fuel Efficiency of 32 Cars") +
  xlab("Weight (x1000 lb)") + ylab("Miles per Gallon") +
  geom_line(linetype="solid", color="red", size=0.5) +
  theme(text=element_text(family="Ariel", size=12)) |]

[rgraph|
  d <- data.frame(age_hs,shoeSize_hs,constant_hs)
  ggplot(d, aes(age_hs)) +
  theme(text=element_text(family="Ariel", size=12)) +
  geom_line(aes(y = shoeSize_hs, color = "showSize_hs")) +
  geom_line(aes(y = constant_hs, color = "constant_hs"), linetype="dashed") +
  coord_fixed(ratio=2) +
  labs(color = "Plot Type") |]

Put this below labs to change legend size?
guides(color = guide_legend(override.aes = list(size = 5)))
let patients = 1000 -- Patient count (limited to 10^6)
let infectionRates = [0.001,0.005..0.4]
let bkevens = take (length infectionRates) (repeat 1000.0)
let (tests,iRates) = unzip $ hermanPlotData patients infectionRates
[rgraph|
  d <- data.frame(iRates_hs,tests_hs,bkevens_hs)
  ggplot(d, aes(iRates_hs)) +
  ggtitle("Tests Required for Infection Rates") + theme_grey() +
  theme(text=element_text(family="Ariel", size=12),
            legend.title=element_blank(),
            plot.title = element_text(hjust = 0.5),
            legend.position="bottom", aspect.ratio=0.7) +
  geom_line(aes(y = tests_hs, color = "tests_hs")) +
  geom_line(aes(y = bkevens_hs, color = "bkeven_hs"),
            linetype="dashed") +
  labs(color = "Plot Type") +
  annotate( geom = "curve", x = 0.1, y = 1400,
        xend = 0.15, yend = 1100,
        curvature = -.3, arrow = arrow(length = unit(2, "mm"))) +
  annotate(geom = "text", x = 0.09, y = 1400,
        family = "ariel", label = "Break Even", hjust = "right") |]

Background color is great and even more awesomeand even more awesomeand even awesome and even more awesomeand even more awesomeand even more awesome and even more awesomeand even more awesomeand even more awesomeand even more awesomeand even more awesome
Background color is great and even more awesomeand even more awesomeand even awesome and even more awesomeand even more awesomeand even more awesome and even more awesomeand even more awesomeand even more awesomeand even more awesomeand even more awesome
alarm            =>  2.965  percent
burg             =>  9.991  percent
burg and alarm   =>  0.2976 percent
alarm given burg =>  2.979  percent
burg given alarm =>  10.04  percent